
")
Starting in the Fall semester of 2021, I begun helping one of my professors under a Graduate Assistantship position. The project revolved around analyzing the individual face photos within TIME Magazine. The data had already been collected by the time I was brought on, so now it was time to display the data visually.
While I was working on this, I was taking a course by the same professor to learn the ins and outs of web development. This means that as the semester went on, I gradually got better at what I was doing. It was actually this project that led to the development of this portfolio website as it is today!
Here are the pages I've made for the Faces in TIME project, from old to new. No templates used -- all coded by me.
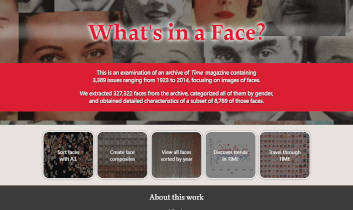
The first page I made for the project. It has been updated to include links for each page, as well as cards at the bottom that credit those who worked on the project.
Click the image or title to interact with the page.
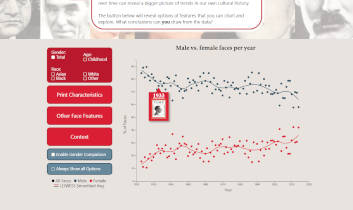
This page was tough to make. On top of having to work off of someone else's chart-creation code, I didn't fully understand the D3 Javascript library yet, so it was a struggle to get this to display as I intended. But with enough time, I made it there. The responsive checkbox layouts were also a huge undertaking for me at the time.
Click the image or title to interact with the page.

Where the other pages took me weeks to make on and off, I was able to make this one in about a day. It was around this point where my Javascript skills really started to take form.
Click the image or title to interact with the page.
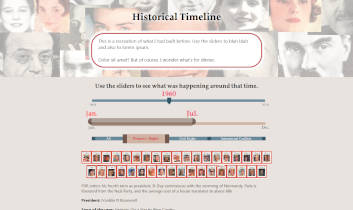
This page loaded content from three different spreadsheets and displayed their info based on the year, months, and social issues selected. When I finally got everything to work with each other, I practically jumped for joy.
The page has since evolved into a new form of this concept, simplified to just selecting the year.
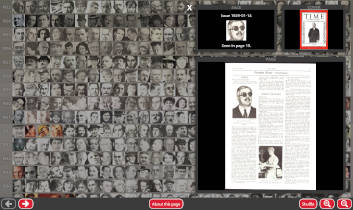
This page compiles all 327,322 faces from the magazines up to 2014 and sorts them chronologically from top to bottom. The buttons at the bottom load further images, apply different zoom levels, and allow the images to be shuffled. Clicking a face showcases its original page. Loading can take a while, so I made an engaging graphic to tide users over.
Click the image or title to interact with the page.
Made in Adobe Illustrator and animated with Notepad coding, these SVGs can make static pages feel more lively.
I figured I would put up some examples of the Javascript code I wrote here. I always do my best to annotate my code so that anyone can understand it.

This code is for the historical timeline page. It looks at the user's input for the sliders, and creates the container that will house the information that gets loaded in later. I originally wrote this to be able to account for a range of years, but ended up only using one year at a time. With more experience, I see how the common phrase in my code, "(i + 1923)", could easily be altered to be more concise.
Continuing off of the previous code sample, this is where the information itself gets loaded into the containers set up prior. It loads each spreadsheet into a different set of data, which all get added to the screen depending on which filters are checked by the user. It does this for each selected month in the selected year, and skips any empty cells of information.


